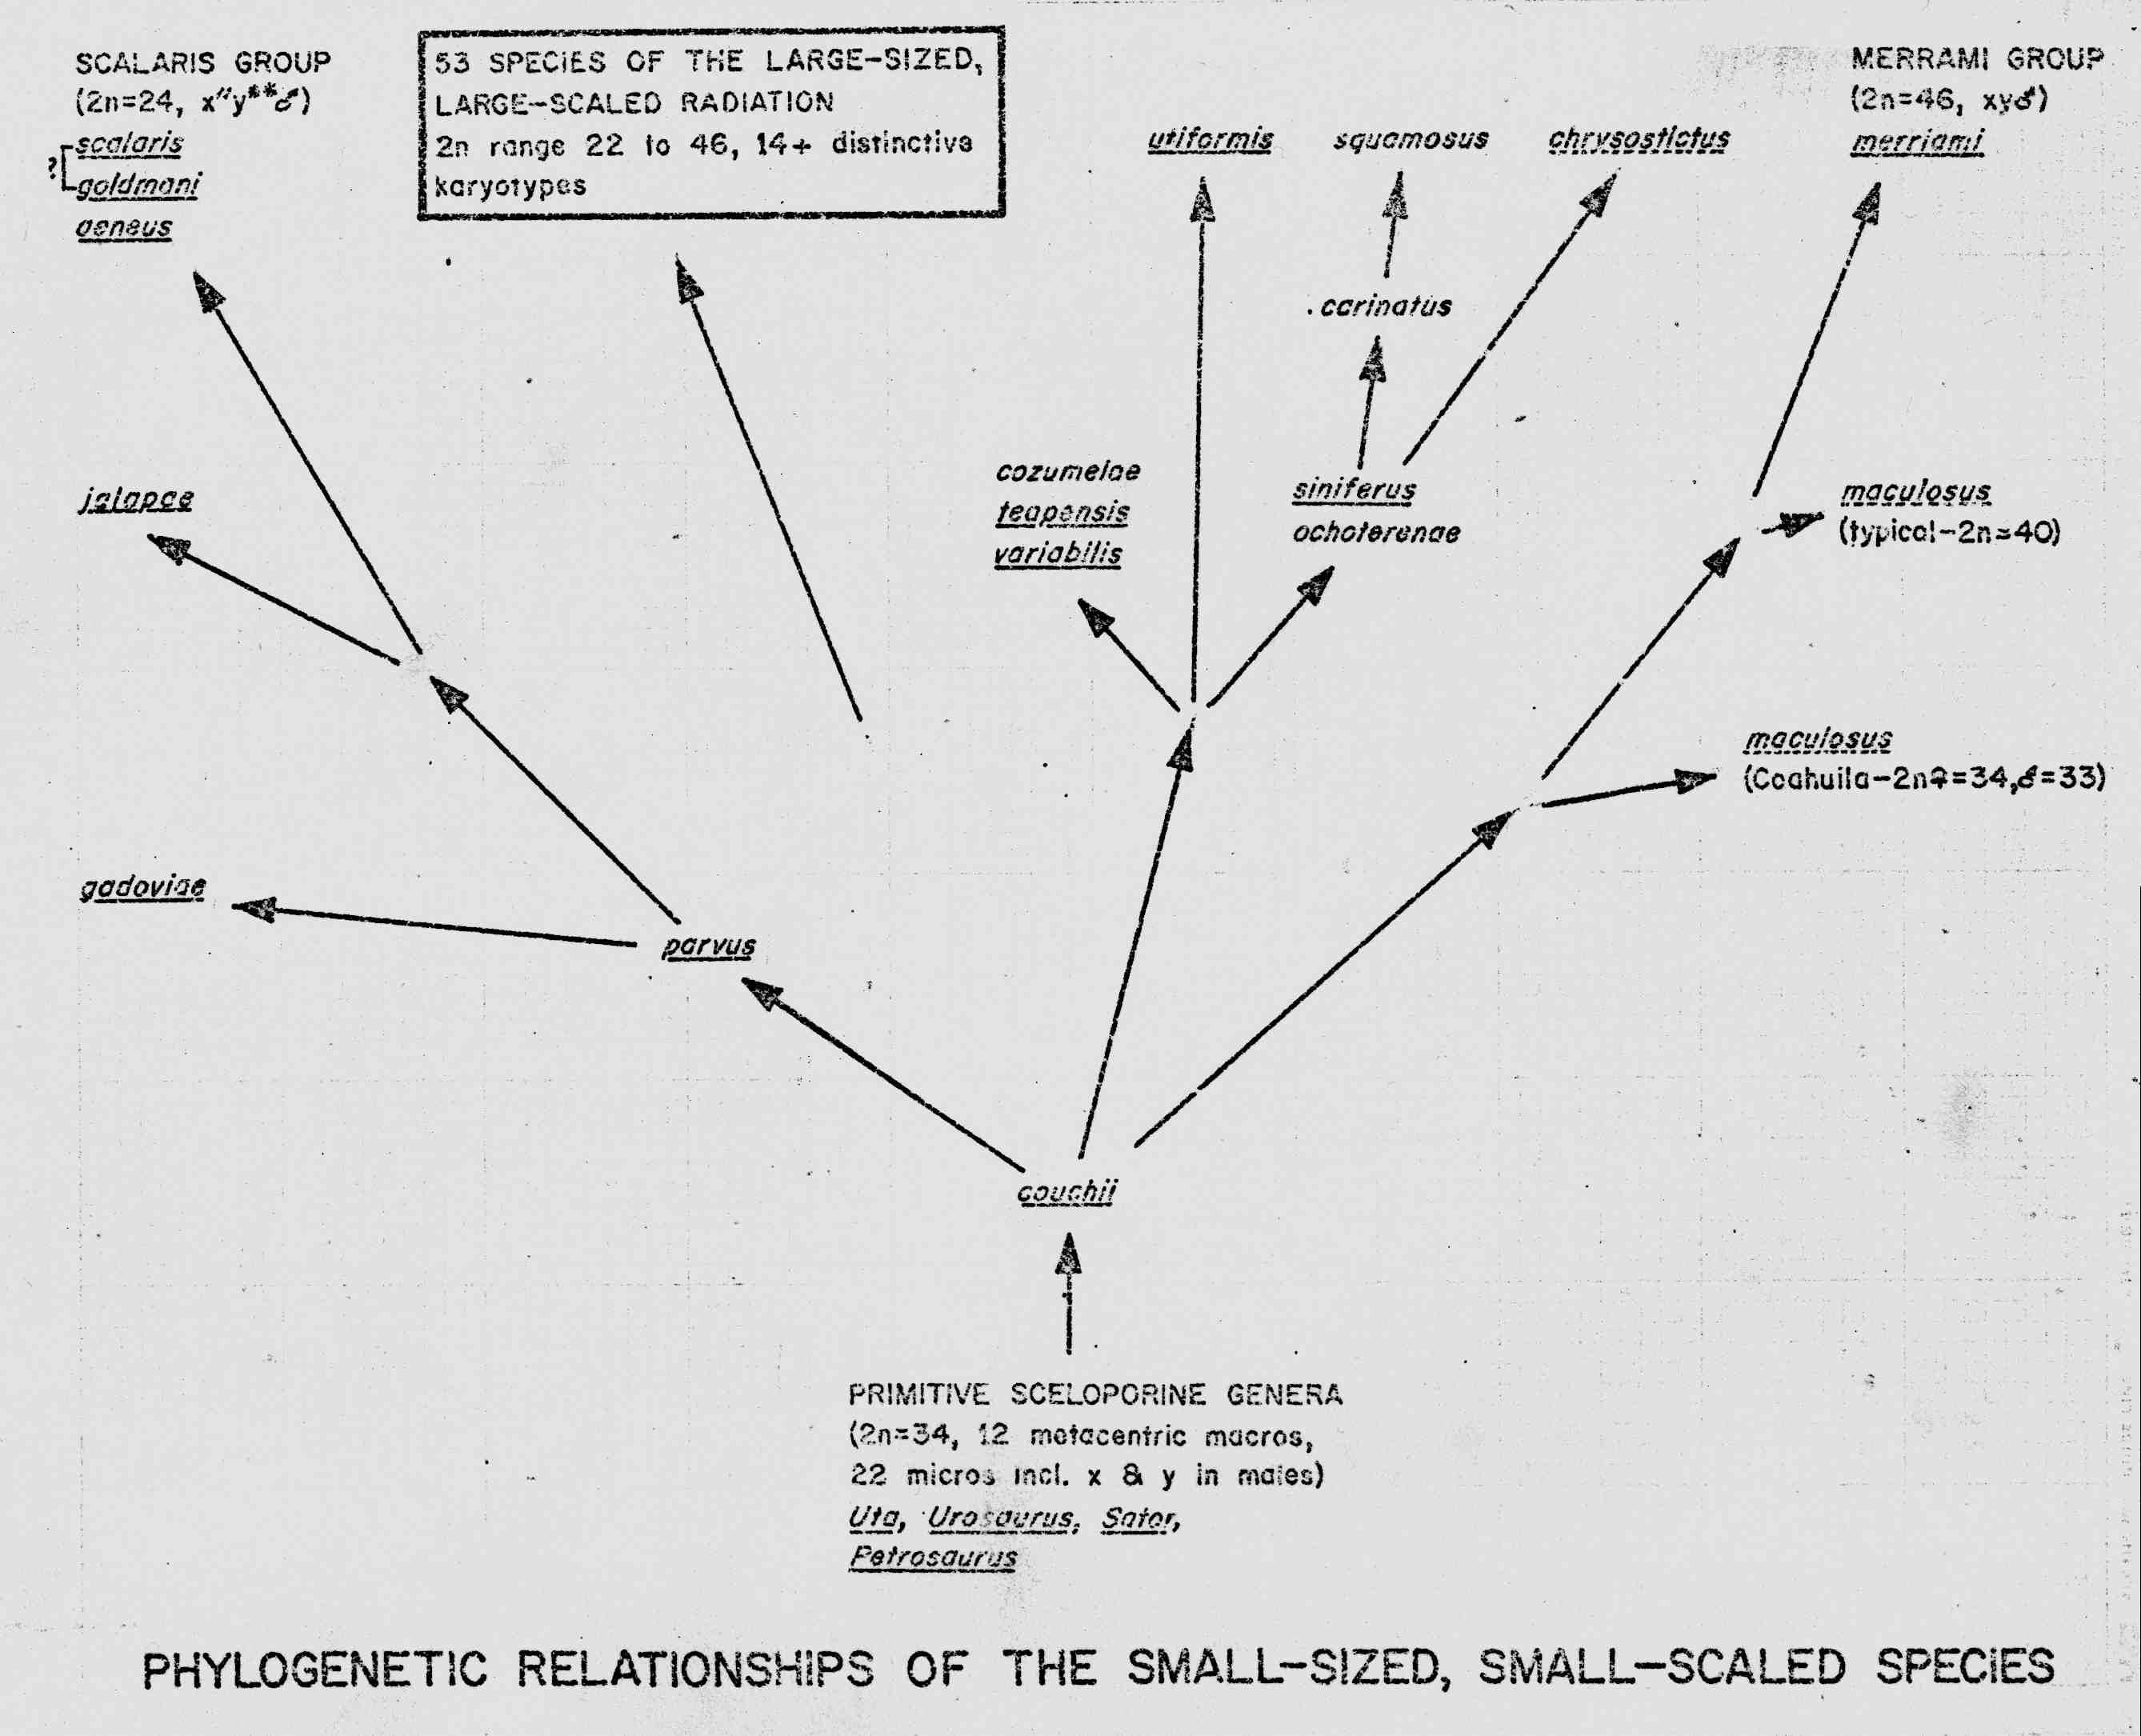
I present the following two illustrations representing my reconstruction of the evolutionary relationships of the species In the small-sized, small-scaled, species of Sceloporus without a detailed discussion of my reasoning. However, much of my justification is discussed, at least peripherally. In the main manuscript of this thesis. The phylogenles are followed by maps showing the approximate ranges of species groups not Illustrated earlier in this thesis.
[Note added in 2003: Figures 1 and 2 are superceded by diagrams in the 1979 manuscript, Cascading chromosomal speciation and the paradoxical role of contact hybridization as a barrier to gene flow.]
Figure 2. Karyotype evolution of the large-sized, large-scaled Sceloporus
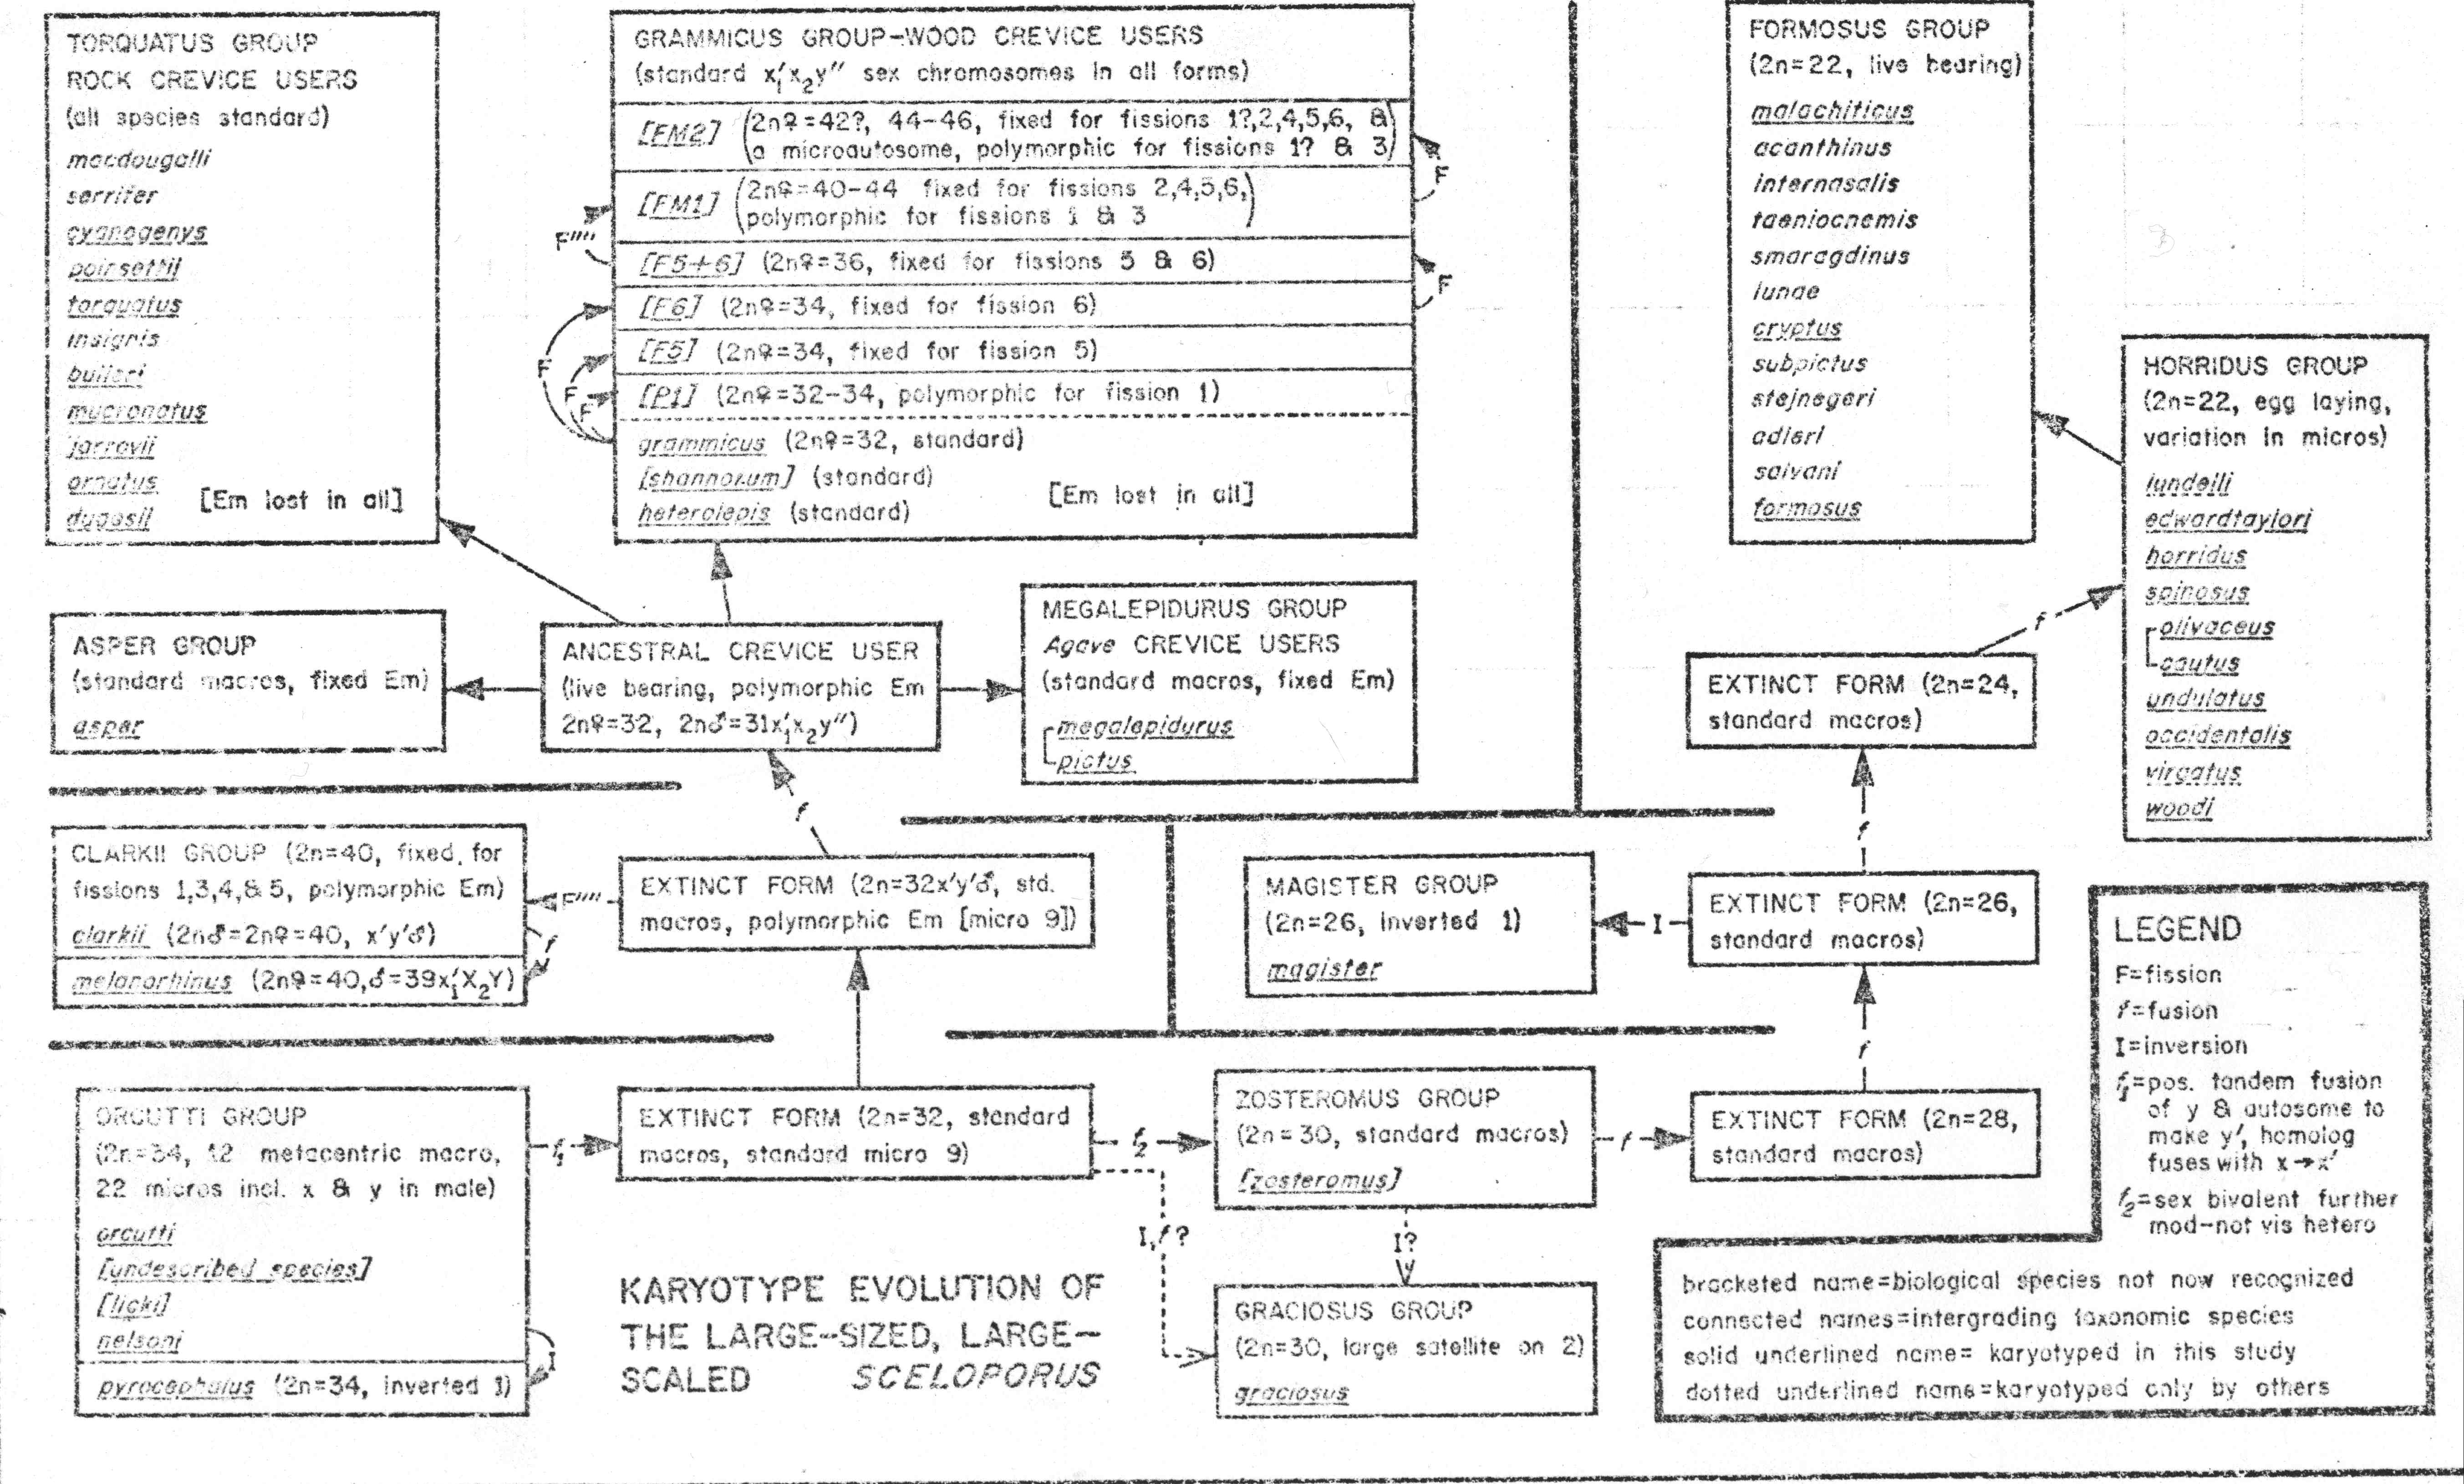
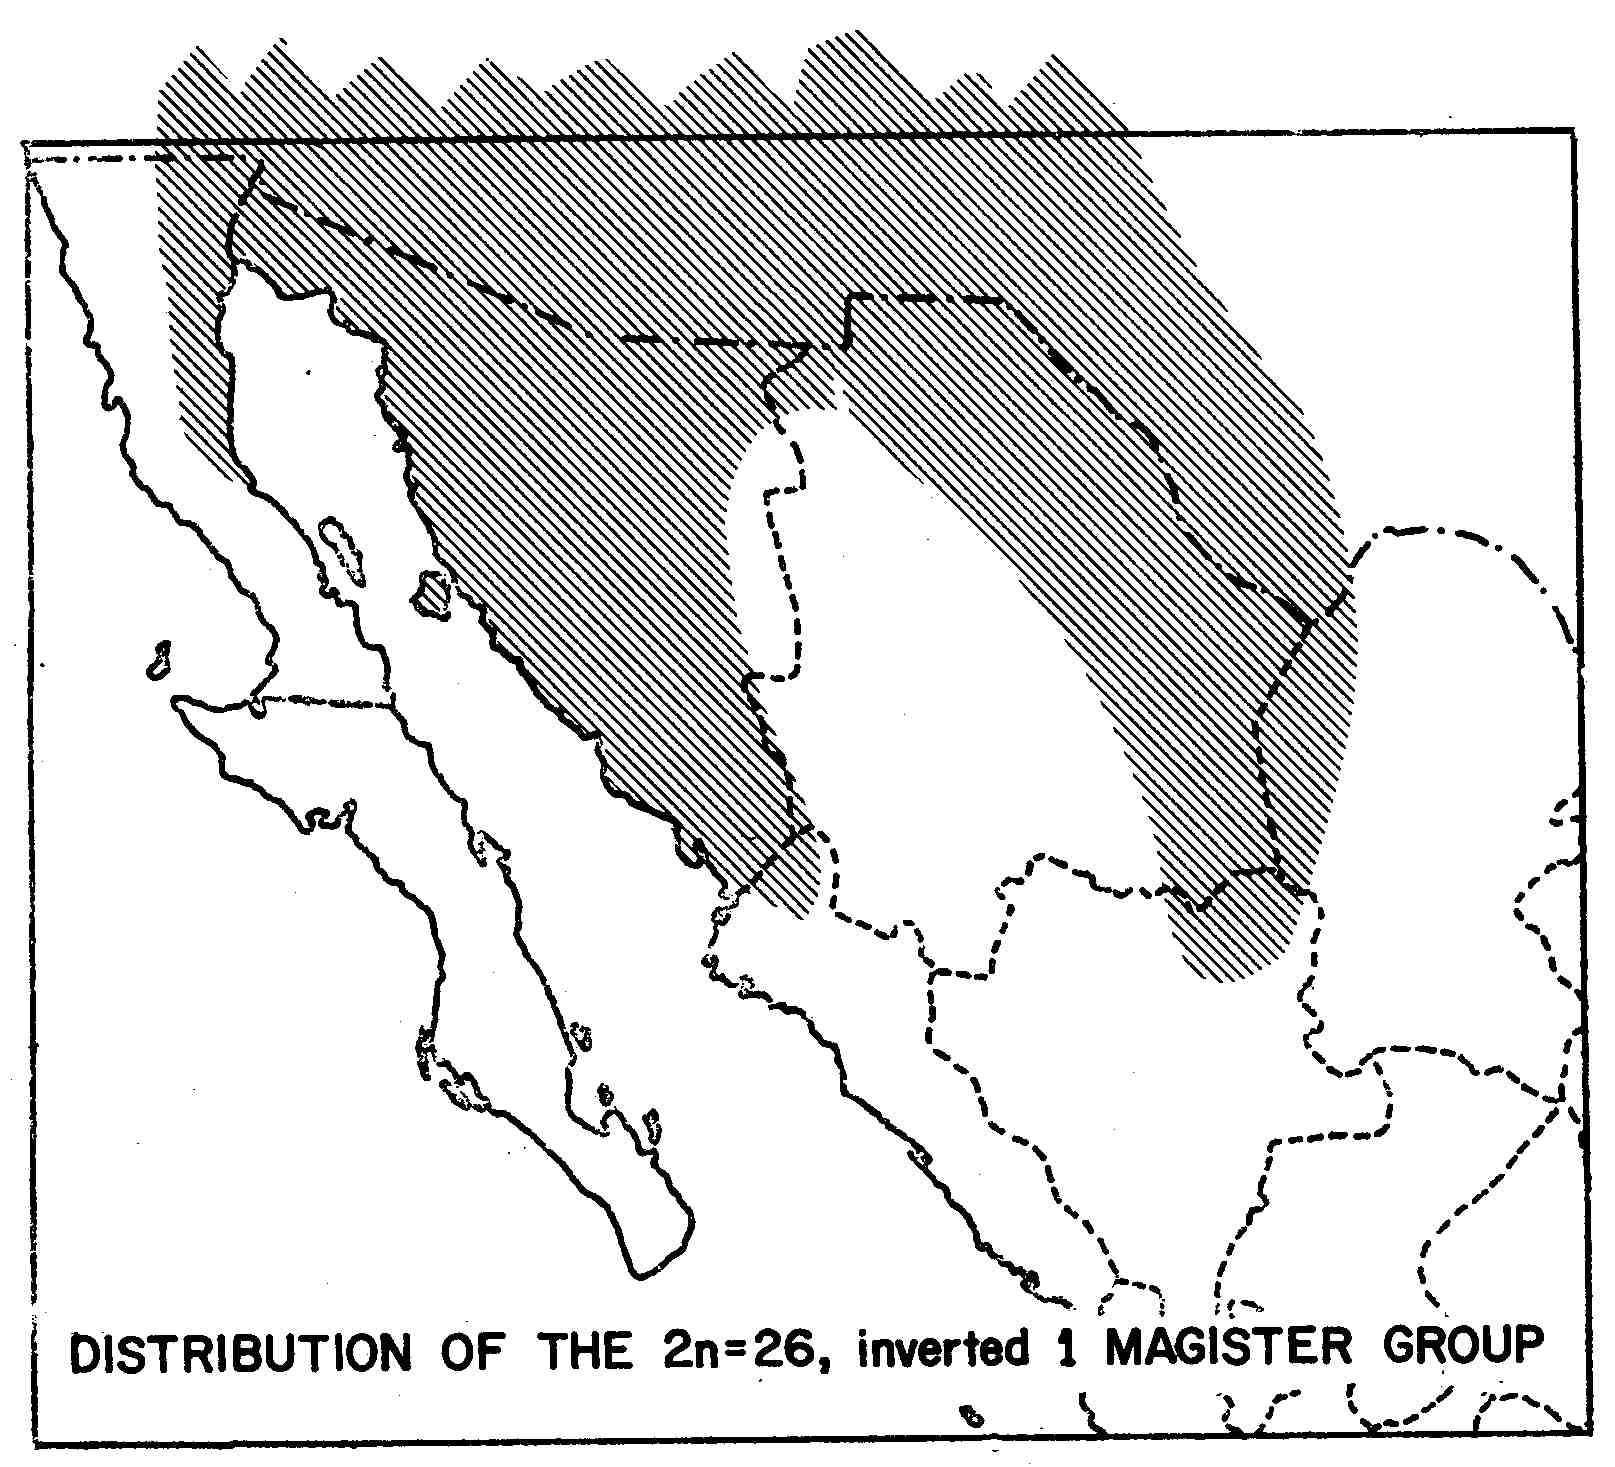
Figure 4. Distribution of the 2n=26, inverted 1 magister group.